Reading earthquake data
Earthquake magnitude vs intensity
Magnitude and intensity are related, but they do not measure the same thing. One describes the earthquake; the other describes its effects at a particular place.
Magnitude is one estimate of the earthquake's overall size, measured at the source. Intensity varies from place to place and describes observed shaking and effects. One earthquake has one preferred magnitude but produces many intensity values — which is why an M7.0 can kill more people than an M9.1.
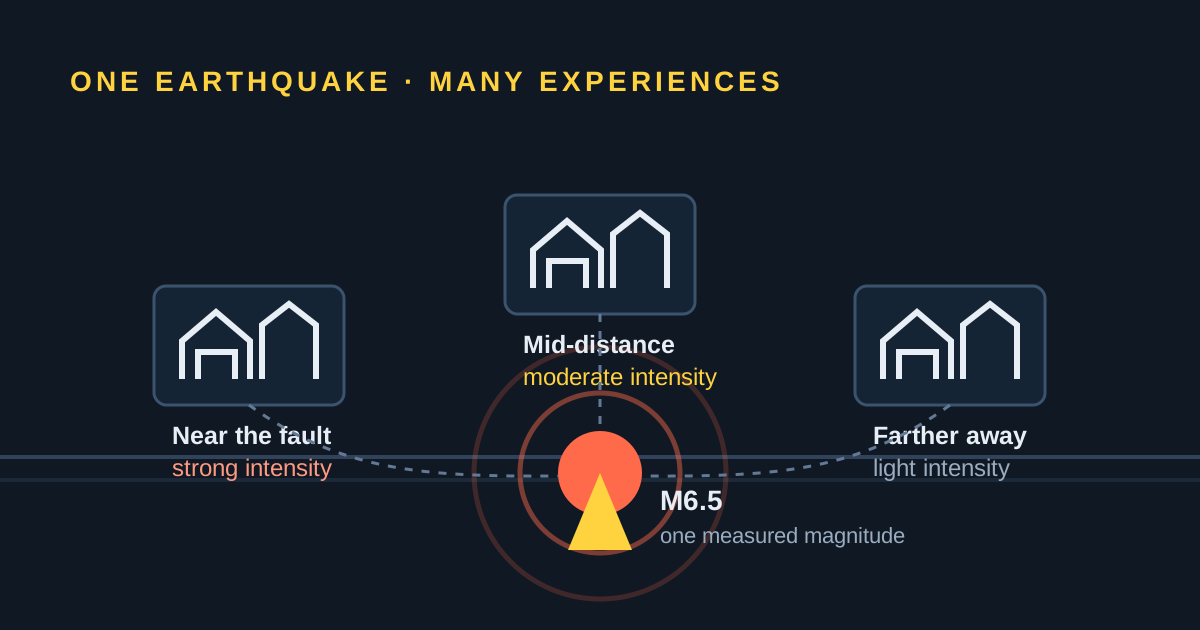
Magnitude measures the size of the earthquake
Magnitude is calculated from seismic recordings, and it is a property of the earthquake itself: it does not change depending on where you measure it. Modern catalogs compute several magnitude types for the same event and then publish one preferred magnitude, keeping the other calculations in the event record. That is why the number you saw an hour after an earthquake sometimes differs from the number in the final catalog entry.
The magnitude type is written next to the value: Mww or Mw for moment magnitude, ML for the local (Richter) magnitude, mb for short-period body waves, Ms for 20-second surface waves. Each one is valid over a particular range of sizes and distances, and each answers a slightly different question about the same rupture.
Magnitude classes and how often each happens
Because magnitude is logarithmic, each class is roughly ten times rarer than the one below it. The counts below are long-run worldwide averages, not a forecast for any particular year. Figures for M4 and smaller are estimates: most small earthquakes occur where no dense seismic network is listening, so they are never catalogued at all.
| Class | Magnitude | About how many per year | What it usually means |
|---|---|---|---|
| Great | 8.0 and above | About 1 | Long ruptures, often on a subduction megathrust; tsunami potential if offshore |
| Major | 7.0–7.9 | About 15 | Serious damage over a wide area if it strikes near people |
| Strong | 6.0–6.9 | About 130 | Can be destructive in populated areas, especially when shallow |
| Moderate | 5.0–5.9 | Roughly 1,300–1,600 | Widely felt; damage usually limited and localised |
| Light | 4.0–4.9 | Roughly 12,000–13,000 (estimated) | Noticeably felt nearby; significant damage is uncommon |
| Minor | 2.0–3.9 | Well over a million (estimated) | Felt only close to the epicentre, if at all |
| Micro | Below 2.0 | Millions | Detected by instruments; almost never felt |
The larger bands are firm because the global network detects everything above about M5: the USGS catalog holds 27 earthquakes of M8.0 or greater and 3,359 in the M6.0–6.9 band for the 25 years to January 2025. Any single year is distorted by sequences, since a great earthquake brings its own aftershocks — an active year in Chile or Indonesia lifts the global count on its own.
Moment magnitude: what Mw is actually derived from
Moment magnitude is not an amplitude reading. It starts from a physical quantity called the seismic moment, written M0, which the USGS defines as:
M0 = rigidity × rupture area × slip — where rigidity is the strength of the rock along the fault, rupture area is how much of the fault surface actually moved, and slip is how far it moved.
Stronger rock, a larger torn area or more movement all raise the moment. Seismic moment is estimated by fitting the recorded waveforms — or, for some events, from geodetic measurements of how the ground itself shifted. It is then converted into a magnitude number designed to line up with the Richter scale over the range where the two overlap. The USGS publishes the conversion as Mw = 2/3 (log10 M0 − 9.1) with M0 in newton-metres; the same formula uses the constant 16.1 when the moment is expressed in dyne-centimetres.
The practical consequence is that Mw stays meaningful no matter how large the earthquake gets, because rupture area and slip keep growing even after the recorded wiggles stop growing. That is the problem the older scales run into.
Saturation: why ML and mb stop discriminating above about M6.5
Saturation is what happens when a magnitude scale runs out of headroom. ML and mb are measured from waves at a fixed, short period — around one second for mb, and the response of a Wood-Anderson torsion instrument for ML. A rupture that is small compared with those wavelengths radiates proportionally more energy at that period as it grows, so the reading grows with it. But once a rupture is tens or hundreds of kilometres long and takes a minute or more to complete, it stops adding energy at one-second periods. The amplitude at that period stops increasing, and so does the magnitude.
The result is that two very different earthquakes return almost the same number. The USGS states the limits directly: mb tends to saturate at about M6.5 or larger, and Ms20 tends to saturate at about M8.3 or larger. Moment magnitude does not saturate because it is derived from the physical size of the rupture rather than from a wave amplitude at one period.
Magnitude scales and where each one runs out
| Scale | Useful range (USGS) | What it measures | Limitation |
|---|---|---|---|
| ML (Richter, local) | About 2.0 to 6.5, within 600 km | Peak amplitude on a Wood-Anderson response instrument | Defined for southern California in 1935; saturates for large ruptures |
| mb (short-period body wave) | About 4.0 to 6.5 | Amplitude of the first arriving P waves near 1 s period | Saturates at about M6.5 and above |
| Ms (20 s surface wave) | About 5.0 to 8.5 | Amplitude of Rayleigh waves near 20 s period | Saturates at about M8.3 and above |
| Mw (moment magnitude) | About 5.0 and larger for Mww; lower regionally | Seismic moment: rigidity, rupture area and slip | Needs enough good broadband data; not the routine choice for tiny events |
Amplitude and energy are two different multipliers
People often mix these up, and the page you are reading needs both. One whole magnitude step means:
- About ten times the amplitude — the height of the squiggle recorded on a seismogram grows tenfold. This is the definition of the logarithmic scale.
- About 32 times the energy — the energy actually radiated grows by roughly 101.5, which is 31.6.
- Two steps is about 1,000 times the energy — from M6 to M8 the amplitude grows 100-fold but the energy grows a thousandfold.
Energy is the number that relates to the potential to damage structures; amplitude is the number that describes the recording. When a news report says one earthquake was “ten times bigger” than another one magnitude unit below it, that is the amplitude statement, and it substantially understates the difference in released energy.
Intensity measures shaking at a specific location
Intensity describes what people feel and what happens to objects, buildings and the natural environment at one place. It has no instrument of its own and no single value for the whole earthquake: a single event produces an entire field of intensities spread across the region around it, generally highest near the fault rupture and falling off with distance.
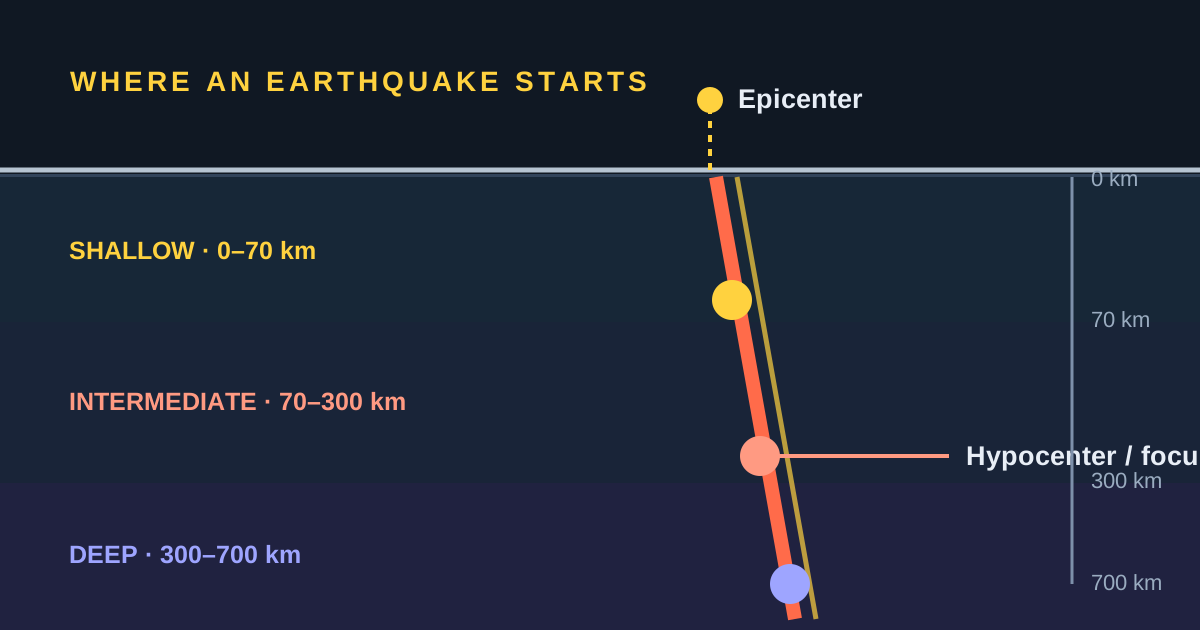
Distance is not the only control. Earthquake depth, the direction the rupture propagated, soft soils, sedimentary basins and the vulnerability of the buildings themselves all change the intensity experienced locally. Two neighbourhoods a few kilometres apart can be assigned intensities two levels apart because one sits on bedrock and the other on soft mud.
The Modified Mercalli Intensity scale, I to XII
The scale used in the United States is the Modified Mercalli Intensity (MMI) scale, developed in 1931 by Harry Wood and Frank Neumann. It has no mathematical basis; it is an ordered ranking of observed effects, written in Roman numerals. The lower levels describe how people perceive the shaking, and the higher levels describe structural damage — structural engineers usually contribute the information behind values of VIII and above.
| Level | Shaking | What is observed |
|---|---|---|
| I | Not felt | Not felt except by a very few under especially favourable conditions. |
| II | Weak | Felt only by a few people at rest, especially on upper floors. Delicately suspended objects may swing. |
| III | Weak | Felt quite noticeably indoors, especially on upper floors. Many people do not recognise it as an earthquake. Parked cars may rock slightly; vibration like a passing truck. |
| IV | Light | Felt indoors by many, outdoors by few during the day. At night some are awakened. Dishes, windows and doors rattle; walls creak. Sensation like a heavy truck striking the building. |
| V | Moderate | Felt by nearly everyone; many awakened. Some dishes and windows broken. Unstable objects overturned. Pendulum clocks may stop. |
| VI | Strong | Felt by all, many frightened. Some heavy furniture moved; a few instances of fallen plaster. Damage slight. |
| VII | Very strong | Damage negligible in buildings of good design; slight to moderate in well-built ordinary structures; considerable in poorly built or badly designed ones. Some chimneys broken. |
| VIII | Severe | Damage slight in specially designed structures; considerable in ordinary substantial buildings, with partial collapse. Chimneys, factory stacks, columns, monuments and walls fall. Heavy furniture overturned. |
| IX | Violent | Damage considerable even in specially designed structures; well-designed frames thrown out of plumb. Substantial buildings badly damaged with partial collapse; buildings shifted off foundations. |
| X | Extreme | Some well-built wooden structures destroyed; most masonry and frame structures destroyed along with their foundations. Rails bent. |
| XI | Extreme | Few, if any, masonry structures remain standing. Bridges destroyed. Rails bent greatly. |
| XII | Extreme | Damage total. Lines of sight and level are distorted. Objects thrown into the air. |
A caveat the USGS itself applies: many of the effects Wood and Neumann used to define X and above turned out to depend more on ground that was liable to spectacular failure than on the strength of the shaking. Those criteria are downweighted in modern USGS intensity assignments, so a very violent earthquake will not necessarily be given a XI or XII today.
EMS-98 in Europe, shindo in Japan
Intensity is national. Europe uses the European Macroseismic Scale (EMS-98), also twelve degrees in Roman numerals and broadly comparable with MMI, but built around explicit vulnerability classes for different kinds of construction — which matters when the same shaking hits a masonry village in central Italy and a reinforced-concrete suburb a few kilometres away.
Japan uses its own scale entirely. The Japan Meteorological Agency's seismic intensity, or shindo, runs from 0 to 7 with 5 and 6 each split into lower and upper, giving ten steps in all: 0 (recorded but imperceptible), 1, 2, 3, 4, 5-lower, 5-upper, 6-lower, 6-upper and 7. It is computed from instrument recordings on a dense national network, so a shindo value is available within seconds and is what Japanese broadcasters report first. If you follow earthquakes in Japan, expect to see a shindo figure quoted alongside the magnitude and to see no Mercalli value at all.
This is the cleanest way to hold the two ideas apart: an earthquake has one magnitude and, at the same moment, many intensities — one for every place that felt it, expressed on whichever scale that country uses.
Where the intensity values on this site come from
Two USGS products generate almost every intensity number you will see attached to a modern earthquake.
ShakeMap produces near-real-time maps of ground motion and shaking intensity after a significant earthquake, combining recordings from the regional seismic networks with the event's location and magnitude to fill in the gaps between stations. It is the instrumental estimate, and it exists within minutes.
Did You Feel It? is the other half: a citizen-science service that turns reports from people who felt the earthquake into intensity values mapped by location. Intensity used to be gathered by mailing questionnaires to postmasters in the affected area; the web form replaced the post. Its strength is coverage where there is no seismometer, which is most of the world.
SeismoWatch does not compute intensity. Our live earthquake map and event pages report the catalog's magnitude, depth and location, and each event page links onward to the official record where those two products live.
Worked example: why an M9.1 killed fewer people than an M7.0
The clearest demonstration that magnitude alone forecasts nothing about harm is to put the two best-known earthquakes of the 2010s side by side.
Two earthquakes, catalog values from the USGS event records
| Tohoku, Japan — 11 March 2011 | Haiti — 12 January 2010 | |
|---|---|---|
| Preferred magnitude | Mw 9.1 | Mw 7.0 |
| Depth | 29 km | 13 km |
| Location | Offshore, about 130 km east of Sendai | 10 km south-east of Léogâne, about 30 km from Port-au-Prince |
| Energy released | Tohoku released roughly 1,400 times more energy than Haiti | |
| Highest intensity in the USGS record | VIII at Fukushima | VIII at Léogâne; VII at Port-au-Prince, Carrefour and Pétionville |
| Human toll | At least 15,703 killed and 4,647 missing, most of them from the tsunami | Official estimates 316,000 killed; other estimates substantially lower, perhaps fewer than 100,000 |
Tohoku was a far larger earthquake by every physical measure, and its highest recorded intensity was no higher than Haiti's. It ruptured offshore, so the strongest shaking dissipated over water, and the great majority of its casualties came not from the shaking at all but from a Pacific-wide tsunami that reached a maximum run-up height of 37.88 m at Miyako.
Haiti's rupture was small by comparison, but it was shallow, roughly 30 km from a capital city of millions, and it struck a building stock that had never been designed for it. The Haitian death toll is genuinely uncertain — the USGS event record itself carries both the official figure and the much lower independent estimates — but on any of those numbers it exceeded Tohoku's.
Magnitude told you almost nothing here. Depth, distance to people, and what those people's buildings were made of did the work. That is the practical reason to read magnitude, depth and intensity together rather than treating the magnitude badge as a severity score.
Does “Richter scale” just mean magnitude?
Not any more. Charles Richter introduced the concept of earthquake magnitude in 1935, and his original definition held only for Californian earthquakes recorded within 600 km on one particular instrument, the Wood-Anderson torsion seismograph. As stations spread worldwide it became clear the method was strictly valid only for certain frequencies and distances, which is what prompted mb, Ms and eventually Mw.
The phrase survives in everyday language, and for a small local earthquake reported as ML it is not wrong. For anything large it is: the value being quoted is almost certainly a moment magnitude. A catalog entry labelled Mw, ML or mb tells you far more than calling every number a “Richter” magnitude.
See magnitude, depth and location together
Every marker on the live map carries its own magnitude and depth, and each event page links to the official record with its ShakeMap and Did You Feel It products.
Frequently asked questions
Can an earthquake have more than one reported magnitude?
Yes. Different methods and additional data can produce revised values. Agencies normally identify one preferred magnitude while retaining other calculations in the event record.
Does a higher magnitude always mean more damage?
No. Damage also depends on depth, distance, local geology, duration, construction and preparedness. Magnitude is important, but it is not a complete damage forecast.
How much stronger is a magnitude 7 than a magnitude 6?
One whole magnitude step is about ten times the wave amplitude recorded on a seismogram and about 32 times the energy release. Two steps, from M6 to M8, is roughly 1,000 times the energy.
Is the Richter scale still used?
Only for small, nearby earthquakes. The USGS lists local magnitude (ML) as useful from about M2.0 to M6.5. Above that range it saturates, so agencies report moment magnitude instead.
What is the highest level on the Modified Mercalli scale?
The scale runs from I to XII. The USGS now downweights many of the original criteria for X and above, because those effects depend more on unstable ground conditions than on the strength of the shaking itself.
Can intensity be measured before people submit reports?
Instrument networks can estimate shaking within minutes, and ShakeMap combines those recordings with the earthquake location and magnitude. Reports sent to the USGS Did You Feel It? service then add what people actually experienced at each location.
Sources and further reading
- USGS: earthquake magnitude, energy release and shaking intensity — seismic moment, the Mw formula and the 32x energy step.
- USGS: magnitude types table — valid ranges and the saturation limits of mb and Ms.
- USGS: the Modified Mercalli Intensity Scale — history, and why criteria for X and above are downweighted.
- USGS: The Severity of an Earthquake — the abridged I to XII descriptions used in the table above.
- USGS FAQ: moment magnitude, Richter scale and why there are so many scales.
- USGS ShakeMap and USGS Did You Feel It? — the two products behind published intensity values.
- GFZ Potsdam: the European Macroseismic Scale EMS-98.
- Japan Meteorological Agency: the JMA seismic intensity (shindo) scale.
- USGS event record: 2011 Tohoku M9.1 and USGS event record: 2010 Haiti M7.0.